The real-time spectrum analyzer is just one of the many remarkable facilities of the WiNRADiO G313 receiver, providing the user with the ability to observe the received signal spectrum and its surroundings visually, and make appropriate adjustments of the filtering. This invaluable feature is largely absent in a conventional receiver, or available at a much higher price.
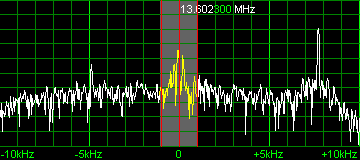
The real-time spectrum display shows the actual situation on the band within the "roofing filter" bandwidth of the receiver. This bandwidth is 15 kHz, but the spectrum display conveniently shows a somewhat wider area of 20 kHz. A central highlighted region of the spectrum changes corresponds to the IF (intermediate frequency) filter bandwidth selected by the user (continuously between 1 Hz to 15 kHz). This highlighted filter passband can be shifted, or its width altered, by simply dragging its center or edges using a mouse, to exactly match the received signal, maximize the signal-to-noise ratio and achieve the best possible signal clarity.
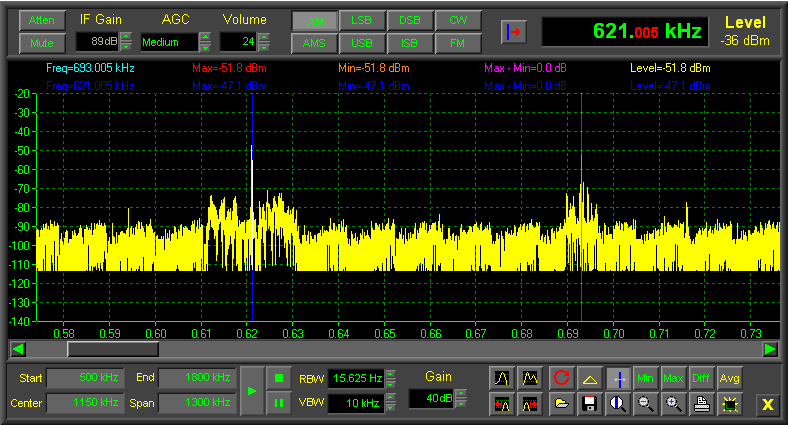
The real-time spectrum is zoomable, calibrated and able to display signal peaks with a resolution bandwidth of less than 16 Hz. A continuously-adjustable smoothing "video filter" is also included.
The spectrum can be also recorded and played back. This makes it possible to "re-receive" the same signal with different settings of the IF filtering and other parameters, and extract the maximum information out of a weak and noisy signal.

One of the demonstrable advantages of software-defined receivers is the enormous flexibility and a potential for development of new features, or innovative and improved implementations of existing features.
For example, the functions commonly referred to as IF shift or Passband Tuning are implemented in the WR-G313 receivers in an innovative and powerful way, which combines the real-time spectrum analyzer with the ability to adjust the IF filter passband precisely to suit the received signal.
In the WR-G313 receivers, this feature works in two possible modes:
1. IF Shift (without BFO change) which makes it possible to tune the receiver to another frequency by simply dragging the entire filter passband over a peak of a visible signal.
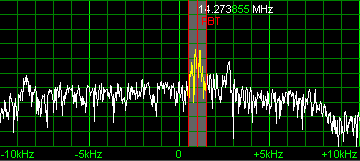
2. Passband Tuning (with tandem BFO change), making it possible to adjust the filter position in SSB and CW modes without detuning the received station.
The first mode applies if the passband center is dragged using the left mouse button. The second mode is activated if the passband center is dragged using the right-mouse button (a PBT symbol will appear to indicate this mode).


